“Christopher is very cerebral and can dig and find approaches that engineers may not have thought about as options. He is excellent at finding new ways to do things when one way is blocked. And, i think he is excellent at being customer-facing and working with the target audience to determine their wants and needs. ”
What is Velocity?
Velocity is an adaptive learning program for struggling elementary students who are 1+ grade years behind in their ELA skills. Velocity is non-linear and relies on a complex learning engine to determine unique student pathways in order to maximize student progress.
What was asked?
Sales and implementation teams need to provide administrative users reports that prove growth and compliance in order to justify the use of their funding sources to pay for Velocity licenses.
My Role.
Principal UX and UI designer. I worked on a small team with the product owner, head of implementation, data analyst and a couple of SME’s. I gathered requirements, led small group collaborations, sketched ideas for quick buy-in or pushback, created wireframes, and expanded the visual design for this project.
MY DESIGN PROCESS
I used a variant of IDEO’s Human-Centered Design thinking process to ensure design decisions were supported by user research, feedback, and created opportunity to help find flaws in our data models.

Where I add a LOT of value. That rapid 'ping-pong' phase....that's where my communication and requirement gathering skills come into play. A huge part of my role in all Velocity projects was creating sketches, and breaking ideas down into simple and easily understood components to ensure stakeholder buy-in.
EMPHATHIZE
INTERVIEWS
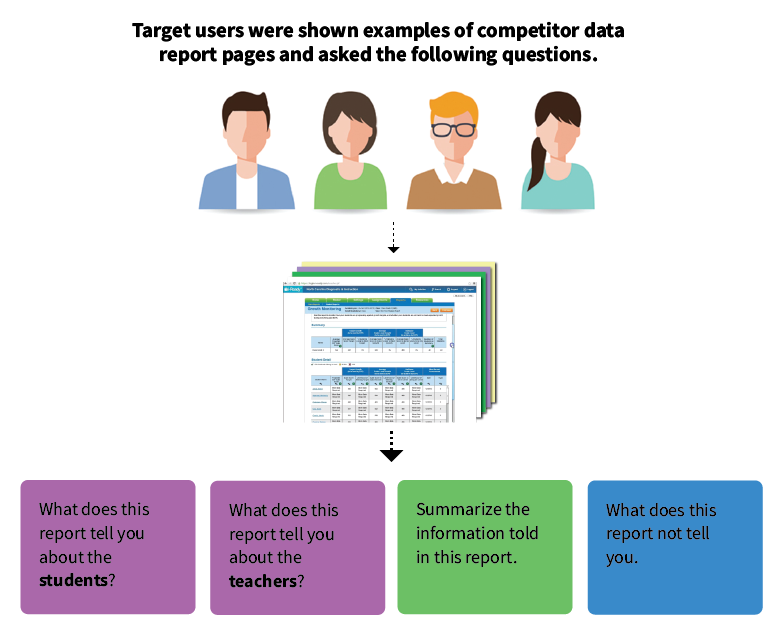
My team set up a workshop with 8 principals and administrative users. The participants were identified by our implementation team as users who have provided detailed feedback on past products. We reviewed competitor reports, orginized a hierarchy of desirable features, discussed concerns regarding proving effectiveness and had a general Q&A where our team could mine them for information and POV.
DEFINE
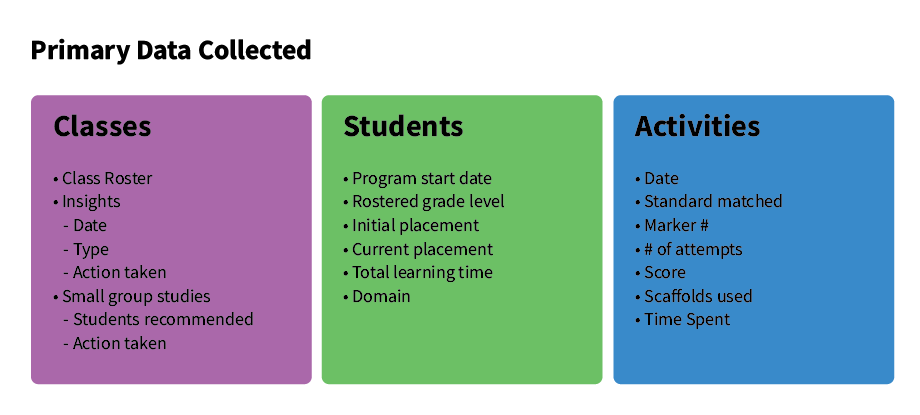
In tandem to researching who the primary user, and what they want, I also inventoried the readily accessible data. Due to resource constraints we would be unable to use any data for the admin report that was not already being collected.
IDEATE
This is where my collaborative nature truly excels as I am able to build my own understanding of a project or product as I realize the POV of the various stakeholders on the team. Realistically, so much is uncovered when the stakeholders start seeing what has been discussed brought to life.
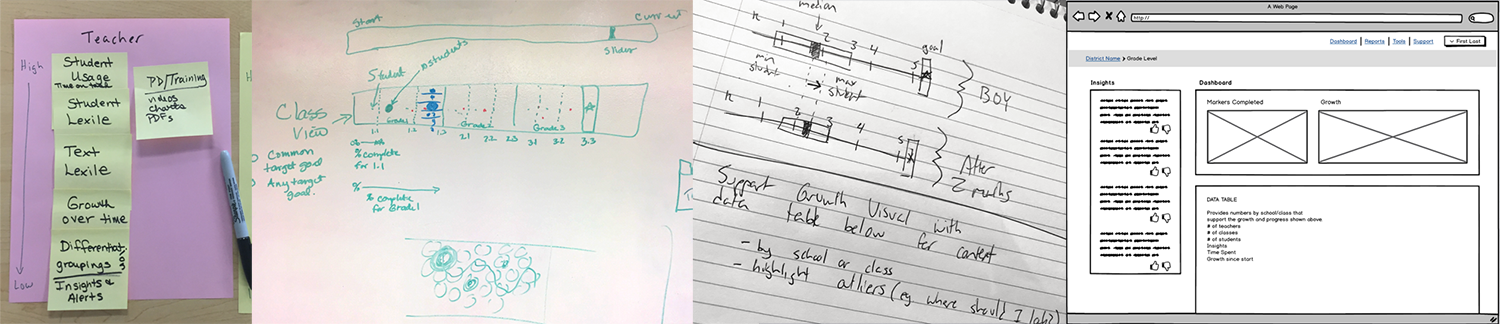
At this point, white boards and notebook sketches where used to give my team members the '30 second pitch' for a direction or an idea. With each iteration, I got closer to a story that met the needs of our internal team as well as created a story that our sales team could coherently deliver to customers.
PROTOTYPE AND DESIGN
The heavy lifting in this project was done primarily before prototyping the design...which was primarily feeding real student data into the visuals. The look and feel was already established so the high fidelity designs came together quickly once sketches were approved.

High Level growth
This module tells an administrative user a very specific growth story.
• Markers completed this week compared to previous weeks.
• Growth shift of a cluster of students rostered to the same grade level.
• A prose statement that summarizes the visuals.
The Context
The data table that corresponds to the visualization above provides context. It also highlights outliers and gives the user the option to drill down to address performance outside of the norm.

GOING DEEPER
An administrative usr as well as a teacher can drill down to an individual students summary and get a quick view of their progress in Velocity. This type of visual helps explain the non-linear progression of a student course work.


VALIDATE
In the end, the curriculum and sales team were satisfied by the story we were able to tell our customers and our engineering team was able to use existing data and API's to quickly deliver a robust experience. Users who need to be convinced of the programs success could drill down to an individual student level and explore the unique learning path guided by the programs engine.
During testing, we did realize that we created new terminology that was confusing to customers. Through follow up surveys and small working sessions we adjusted the language used to describe students placement within a grade level so that we continued to be accurate but also avoided confusing customers by commingling phrasing used for other purposes in some districts.